The independent leaderboard
Benchmarks, weighed honestly.
Every lab's own slides put its newest model on top. Independent evaluators run the same tests on everyone, publish their method, and can't quietly cherry-pick — so when the scoring is done by someone with nothing to sell, the ranking changes. These plates redraw that third-party record.
31 models · 11 labs · 05 plates
The record
Third-party data only
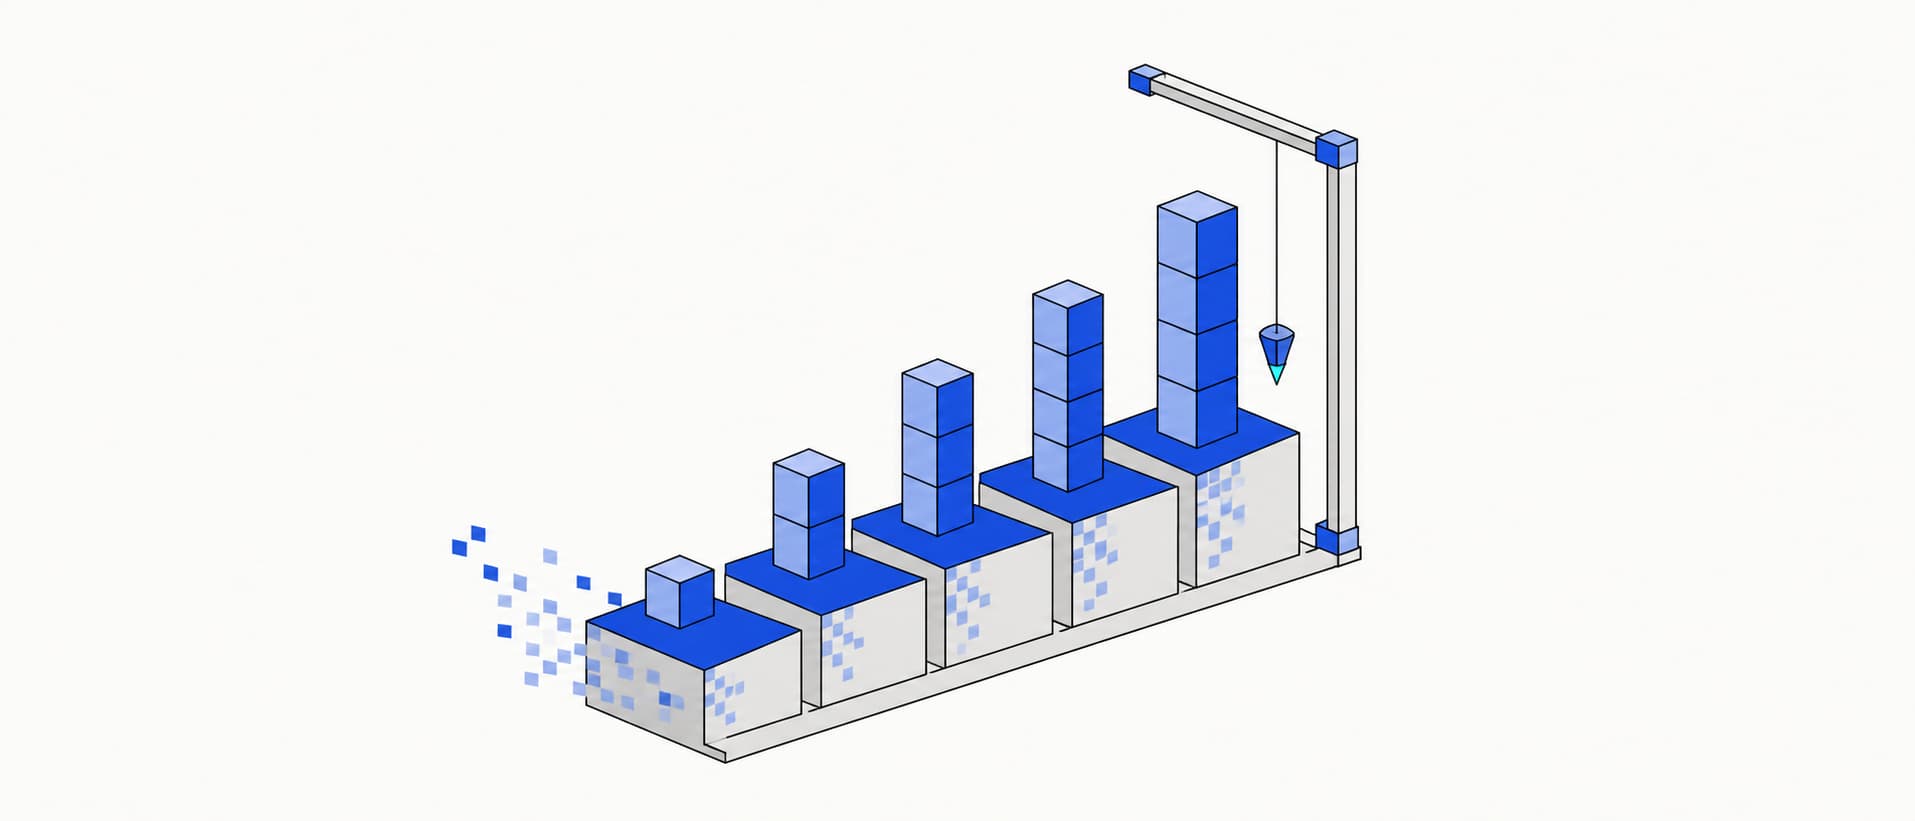
Fig.01 — Measured against one rule
/EDUCATION/RANKINGS
- 01Models charted
- 31Every model reporting the independent intelligence index
- 02Labs represented
- 11Frontier and open-weight houses, one key
- 03Top index score
- 60Highest AA Intelligence on the board
- 04Largest reality gap
- −57.4Points lost from SWE-bench Verified to Pro
Intelligence index
31 models · 11 labs
Which models are actually smartest
The Artificial Analysis Intelligence Index — one composite of roughly ten independent evals — for every model that reports it, ranked highest first.
Independent data · Artificial Analysis
AA Intelligence Index · ranked
31 models · index 0–60
Value
Quality versus price
Where the value actually is
Intelligence against blended price per million tokens — a 3-to-1 input/output blend on a log scale, because the field spans roughly 150×. Up and to the left is the sweet spot; the dashed rule traces the efficiency frontier, where nothing offers more for less.
Independent data · Artificial Analysis
AA Intelligence × blended price
31 models · log $ / 1M · 8 on frontier
Reality gap
Benchmark versus job
The fall from Verified to Pro
A model's SWE-bench Verified score is the leaderboard number. SWE-bench Pro — harder and contamination-resistant — is closer to the job. The drop between them, sorted largest first, shows whose coding scores don't generalise.
Independent data · SWE-bench Verified & Pro (Scale AI)
SWE-bench Verified → Pro · the fall
13 models · mean drop 26.4 pts
Agentic reliability
Terminal-Bench Hard
Getting real work done in a terminal
Terminal-Bench Hard runs long-horizon agentic tasks end-to-end in a real shell — editing files, running tools, recovering from errors. It is the closest thing to the job, and even the frontier sits far below saturation.
Independent data · Artificial Analysis
Terminal-Bench Hard · ranked
05 models · 0–80%
Contamination-resistant coding
DeepSWE
The benchmark that closed the loophole
Datacurve built DeepSWE — 113 original tasks across 91 live repos — after finding SWE-bench Pro shipped full .git history in its containers, letting some models read the gold patch straight from the log. DeepSWE ships shallow clones, verifies with a 0.3% false-positive rate, and spreads the field back out: the frontier sits near 70%, nowhere close to saturated.
Independent data · Datacurve
DeepSWE resolve rate · ranked
08 models · 0–80%
Method
How to read these plates
Our drawings, someone else's numbers.
Every plate above is our own visualization of publicly reported, independent third-party data — redrawn in the house style, not a reproduction of any provider or aggregator chart. Figures reflect the dataset at time of writing; the live boards linked in each plate carry the current record.
- One axis of colour
- Each plate is coloured by exactly one thing — lab family, or benchmark — and the key always names it. Nothing depends on hue alone.
- Shared hues
- There are more labs than accent colours, so some families share one. Read the colour beside the model name, never on its own.
- Missing bars
- A model only appears on a plate when it reports that benchmark. Absence is a gap in the public record, not a zero.
- Blended price
- Three parts input to one part output per million tokens — the blend the independent boards publish.